
At Finance4Learning we notice this autumn that most institutes have adapted to the new reality and that - despite the 2nd Corona wave - there is plenty of entrepreneurial spirits again. A good case. We are already in the fourth quarter, so it is high time to make plans for 2021. To help you with that, we analyzed the most recent annual figures of dozens of thriving private institutes with a combined turnover of approximately €350 million (more than 10% of the market).
Key Figures
There may be several reasons to take a closer look at the key figures of dozens of fellow institutes. For example:
-
Benchmarking
It is always good to compare your own performance with that of others. What do you do better/worse than the market and what can you learn from that?
-
Budget 2021
One thing is for sure, the plans you had made for 2020 have now been thrown into the trash. A budget for 2021 in which you base yourself, among other things, on objective key figures, could give banks, investors and yourself a better sense of its feasibility.
-
Curiosity
We all want to know how much money is made in this industry, right?
Explanation
The above key figures are distilled from the annual reports filed with the trade register of many dozens of successful training institutes. The most recent annual figures (usually 2018 and 2019, with or without a broken financial year) were used for the analysis. The results are weighted, ie institutes with a larger turnover have a greater impact on the key figures than smaller institutes. The following should also be noted for each post:
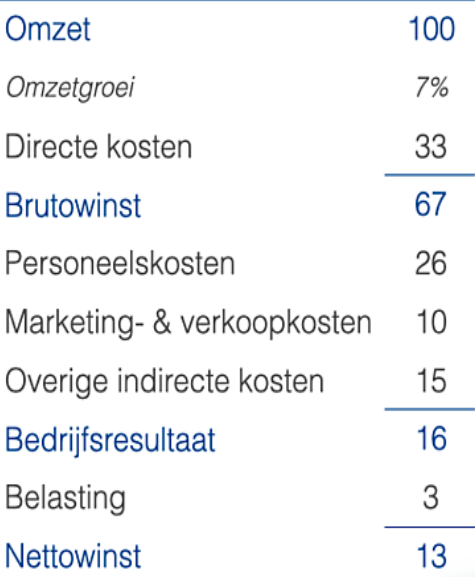
Revenue
The joint turnover of the researched institutes amounted to approximately €350 million. Most institutes managed to grow. Average turnover growth was 7%, which is a good result in a mature market.
Direct costs
Freelance trainers and coaches make up the bulk of the direct costs. The differences between the institutes were sometimes considerable. Trainers, for example, a rollover between 3 and 6 times. Capacity utilization will undoubtedly fall during the corona crisis, so the gross margin of 67% is expected to come under pressure.
Personnel costs
On a full-time basis, the all-in personnel costs per employee are €49,000. A substantial amount, which is perhaps partly explained by the level of education required to be able to work in this sector. Furthermore, the researched institutes have been around for longer, so the average age of the employees is perhaps a bit higher?
It is good that the government is supporting the market during this exceptional crisis. We examined how much support the institutes received during the first NOW round. In total, the institutes received almost €6 million, or more than 6% of the annual personnel costs. Whether your institute and/or that of the competitor also received NOW support is public information and can be found here.
Marketing & Sales Costs
More than 10% of the turnover is spent on marketing & sales costs. This is a post that is quickly cut back in times of crisis. That is a logical response but seems unwise if the competitor does remain visible. The percentages varied considerably between the various institutes.
Other indirect costs
Because institutes do not always classify the costs, in the same way, it was impossible to break down these costs further. This item includes other costs such as depreciation, office costs and even (somewhat improper) financial charges (1% of turnover).
Operating result
With 16% of the turnover, the operating result can certainly be called decent in a mature market. Such a percentage provides a good buffer. This, coupled with measures such as cutting costs and making good use of support measures, should ensure that most of the researched institutions should be able to survive the corona crisis.
Net profit
The net profit of 13% referred to here does not take into account a number of exceptional items. However, because these often had a one-off and/or atypical character, they have not been taken into account in this overview.
Balance
Naturally, the balance sheets of the training institutes were also examined. It soon became apparent that there are enormous differences in the way in which the institutes report on this. Whether or not to include intangible assets, for example, had a major impact on equity positions. Drawing up key figures on the basis of publicly available information, therefore, did not seem useful from a benchmarking perspective. It was possible to determine what the debtor days were. Many institutes managed to limit the debtor days to approximately one and a half months. However, there were also outliers up to 150 or even 200 days. On average, the debtor days were 72.
To ask?
Of course, we are prepared to explain the analysis. Please note, that although the information is publicly available, we at Finance4Learning will never discuss the results of individual companies with third parties. But we are happy to answer questions about the market and about this analysis in a more general sense.