- ECB lags far behind other central banks
- There is some justification for this, but the ECB is taking a significant risk in doing so
- US inflation is bubbly on all sides
- Global aviation is not yet back to pre-2020 levels
- Number of sea containers shipped drops sharply in February
- The number of bankruptcies in the Netherlands is increasing
Google Translated from Dutch to English. Here is the link to the original article in Dutch. The article was originally published on 15 April 2022.
For the time being, the ECB is sticking to the plan outlined in March. Gradually reduce bond purchases first. These will be stopped in the third quarter of 2022, and there may be interest rate hikes, but exactly when remains unclear. I find that very laconic. In my view, the ECB is taking the risk that inflation will spread further than desired through the economy. The ECB is now also lagging far behind other central banks that have already started monetary tightening.
Now I have to admit that there is some justification for the ECB to lag behind. Hopefully, the next two pictures will make that clear. The first picture shows inflation in the US and the Eurozone. In the US, it rose to 8.5% in March. Eurozone inflation stood at 7.5% in March, not much lower than US inflation.
Inflation (total, %)
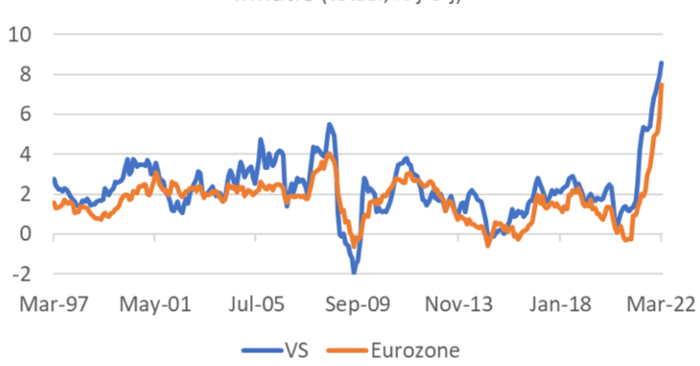
USA | Eurozone
A different picture emerges when looking at core inflation. As the following picture shows, it was 6.5% in March in the US and 'only' 3.0% in the eurozone. Core inflation does not consider the rise in food and energy prices, and the European measure also excludes alcohol and tobacco.
The significant difference between core inflation in both economies indicates that the inflation process has spread further through the US economy than through the European one. As a result, the ECB can adopt a slightly more wait-and-see attitude than, for example, the Fed. But yes, you can also say, "look at the slight panic at the Fed, and you would like to prevent that, so do something now". We know it takes time for monetary policy to be fully effective. It would help if you did not wait until it is too late with monetary policy. Central bankers are paid to estimate future developments and formulate policy now.
Core inflation (total, %)
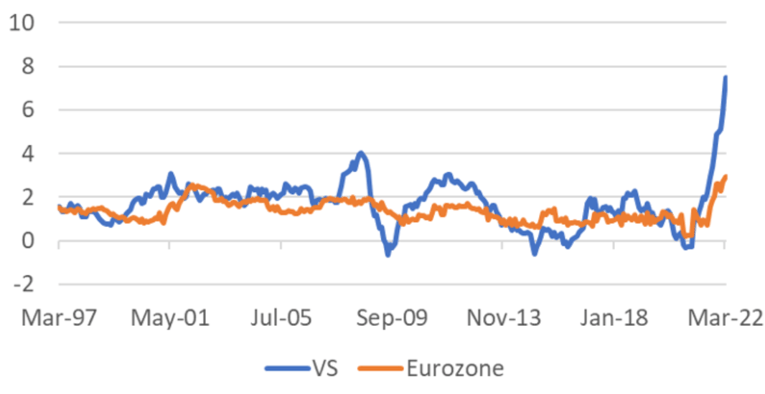
USA | Eurozone
US inflation will fall but won't be back to 2% anytime soon
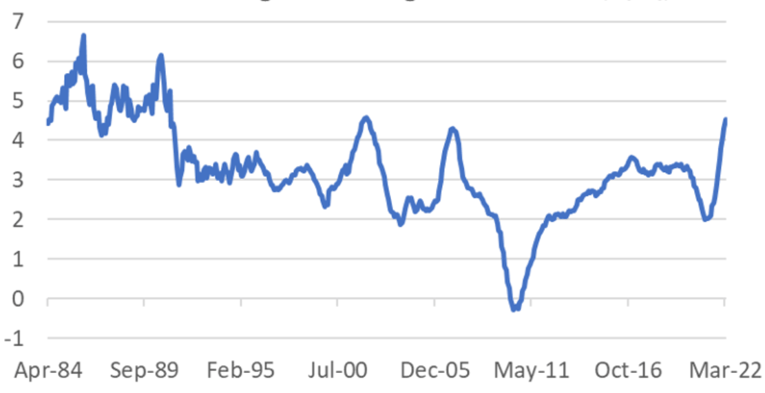
By the way, I want to repeat what I have already written several times. It is an illusion to think that US inflation will fall to 2% in the foreseeable future. It may well be that inflation in the US is now close to or even at its peak, but the desired 2% is quite far in the future. The reason for this lies in the housing market. House prices in the US have risen sharply lately, just like in the United States. The rental market in the US works very differently than here. We have a large social sector, and the government has restricted rent increases. Tension in the rental market manifests itself in shortages instead of rent increases. But in the US, rents follow house prices, albeit delayed. Actual rents paid and imputed to homeowners weigh more than 31% of the American inflation basket (more than 22%). As the following chart shows, the increase in homeowners' imputed rents in the US is now 4.5% (with us 0.7%). Actual rents were 4.4% higher in March than a year ago. I think rent increases in the US will continue to rise for the time being. Naturally, the rise in interest rates will dampen house prices and increase rents after some time, but that takes time.
US: Rent imputed to homeowners (%)
The calm of relative prices from a period of low inflation has been replaced by bubbles
The following picture invites you to briefly discuss the dynamics of the current inflation process in the US. The picture shows the price development of three utterly different spending categories. In 2019 – and before that, too – the picture was relatively stable. Inflation was low, and the prices of these spending categories were not far out of line. Then the corona time begins, and the relative peace is rudely disrupted. Travel is limited, and the lower demand for air travel and overnight stays in hotels, motels and B&Bs are pushing their prices down. The need for cars is increasing because people suddenly have more money to spend on goods because they can spend less on services. They may also prefer not to use public transport. Car makers are having problems with their production due to chip shortages. The result is a sharp rise in the price of used cars. The inflation of used cars will inevitably moderate and eventually, prices may even fall again, but that is not an issue for the time being.
Last year, life became somewhat freer, and the more accessible overnight stays increased again. Prices before that have recovered, and the chart shows that prices have continued to rise and are now well above pre-pandemic levels. Air traffic has not yet returned to pre-pandemic levels. However, the cost of airline tickets is now on the rise. In March alone, the price of airline tickets rose by 9.7% compared to February and more than 23% compared to March 2021, but flying is still slightly cheaper than before the pandemic.
I conclude that the US inflation process is far from settled. It bubbles on all sides. During low inflation, there were also little changes in relative prices. This is important because those changes in comparable prices play a crucial, guiding role in our market economy. Those comparable prices are shooting in all directions now that inflation is high, disrupting the economy.
US: Price Indices (2018 = 100)
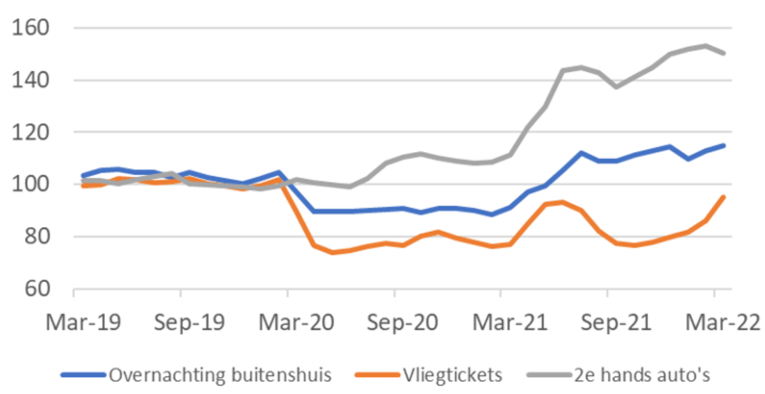
Overnight away from home
Airline tickets
2nd hand cars
Air traffic recovers but is below the 2019 level
That flying is still slightly cheaper (according to US price statistics) than before the pandemic is consistent with the level of air traffic. The following picture shows that although the number of flights per day is currently clearly higher than in 2020 and 2021, it is still lagging behind the numbers of 2019.
Global number of commercial flights per day (1000*)
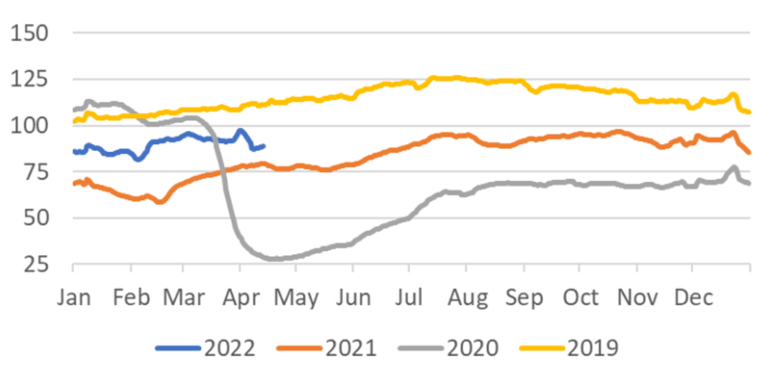
Schiphol's figures paint the same picture. The number of flights via Schiphol is still a bit further behind in 2019 than worldwide. Part of this may be due to the low number of Asian tourists. I don't miss anything about that, but it is undoubtedly a loss for the tourist industry. Those few Chinese tourists you see at Schiphol are often still wearing those weird white paper (?) jumpsuits….
Incidentally, Schiphol's figures also suggest that the occupancy rate of aircraft is currently clearly lower than before the pandemic.
Traffic through Schiphol (index 2019 = 100)
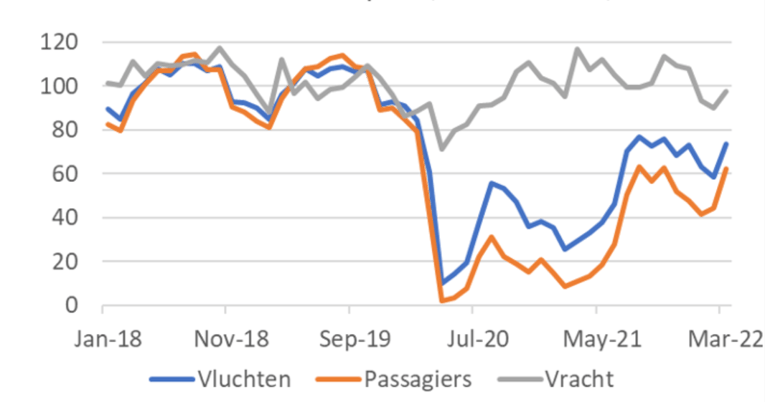
Flights \ Passengers \ Freight
New decrease in shipped sea containers
It seems that the influence of the war in Europe is beginning to show itself in the statistics. The following picture gives an impression of the number of sea containers shipped worldwide. That dropped in February. In northwestern Europe, the decline was very sharp. The war started a few days before the end of February, so the decline in February may have been due to other factors. The Chinese New Year disrupts the numbers every year and now the lockdowns in China are on top of that. The March figures will provide more clarity. But then again, there may be other sources of uncertainty.
Number of sea containers shipped (index 2015-100)
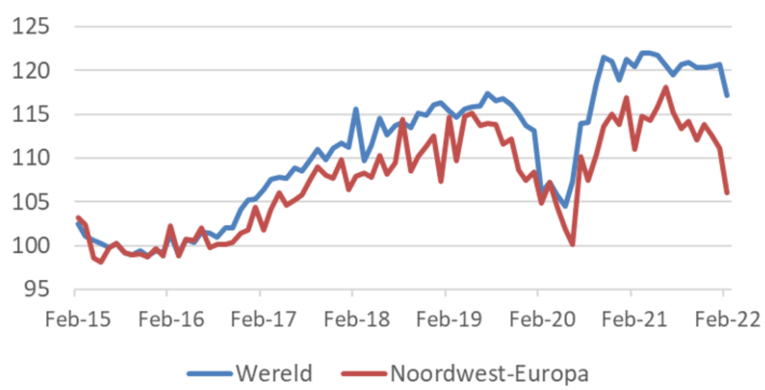
World \ Northwest Europe
Number of bankruptcies in our country beyond the bottom
The Chamber of Commerce previously issued a message that many companies are about to go bankrupt. Several 200,000 even appeared in newspaper headlines. The last picture of this week shows the number of bankruptcies of 'companies and institutions.
Before the pandemic, the number of bankruptcies was already deficient, and during the pandemic, that number continued to fall, contrary to initial expectations. We see the same in other countries, but perhaps not as clearly as with us. In the meantime, the number of bankruptcies is no longer decreasing. A slight increase is apparent now that government support measures have ended. On top of that, the war, the sanctions and the increased raw material prices. The number of bankruptcies will likely increase considerably in the coming period. That isn't very pleasant for those involved, but it gives the market economy dynamism. Hopefully, those involved can make a new start soon.
Using my carpenter's eye and the back of a cigar box, I estimate that in recent years we've had an 'under-mortality' of companies of somewhere between 8,000 and 16,000. A considerable number of these will undoubtedly fall over. How fast that will go is anyone's guess. I wouldn't be surprised if the number of companies that go bankrupt every month will gradually increase from just over 100 to about 500 in the coming period.
The Netherlands: Bankruptcies of companies and institutions
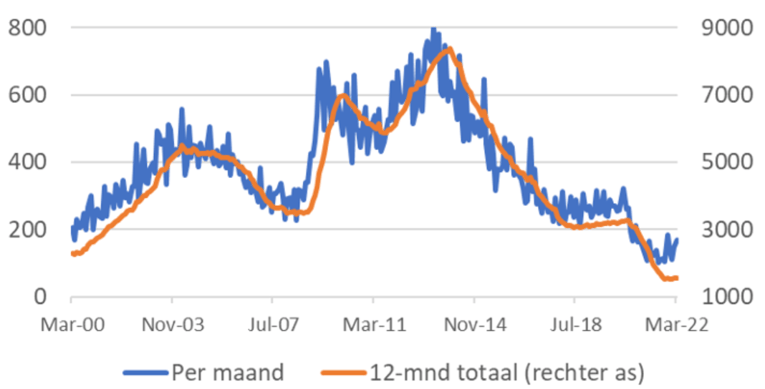
Per month
12-month total (right axis)
Closing
Inflation in the US has continued to rise, and I don't think it's likely that the figure will fall to 2% soon. The rise in rent alone is far too strong for that. Those who take the trouble to delve into the details of the inflation report will find that inflation has risen sharply, and the differences between the spending categories have also increased sharply. That makes everything very unpredictable, in my opinion.
The ECB is pretending that the inflation outlook for the eurozone is very different from elsewhere. There is certainly some difference, but whether that justifies waiting so long with monetary tightening I doubt.
Aviation is recovering worldwide, but activity is still considerably lower than in 2019.
World trade has made an impressive recovery from the corona recession. But in February, the number of sea containers shipped fell remarkably sharply. Whether that was caused by the Chinese New Year, Chinese lockdowns or the war in Europe and related sanctions is not clear. The figures for March may shed more light on this.
The number of bankruptcies in our country is starting to rise. This trend will no doubt continue now that government aid has ended and the effects of the war have begun to take hold.